The Cincinnati
Portfolio

Three stabilized multifamily assets in northern Hamilton County featuring 234 units, assumable agency debt through 2029, large floorplans, and below-market rents.

Heritage at Wyoming
Village Square Townhomes
The Wimbledons
234Total Units
3Assets
$37.05MPurchase Price
~$40.19MTotal Capitalization
~$9.34MMax Outside LP Raise
8.10%Blended Going-In Cap
5-YearTarget Hold
Assumed DebtThrough 2029
Base Case Investor Returns

Projected LP Returns

Explore the underwriting
9.8% Avg. Operating Cash-on-Cash
19.4% LP Net IRR
2.21x LP Equity Multiple
$23.0M Projected Total LP Distributions

Base-case financing assumption: the outstanding loan balances are refinanced in 2029 at 6.25%, with no cash-out distribution. Approximately $301,000 of refinancing costs is financed into the replacement loans; projected returns include the additional interest and repayment at sale. Financing remains subject to lender approval. Projected returns are illustrative, not guaranteed; see the sensitivity analysis and methodology for assumptions.

Next Step

Interested in the Cincinnati Portfolio?

Offering documents and subscription materials are currently being prepared. If you would like to discuss the opportunity with us or be notified when the offering documents become available, please contact The Laager Group and indicate your interest.

Any indication of interest is non-binding and does not constitute a subscription, commitment to invest, or reservation of an allocation.

Indicate Interest
LP Economics

Sponsor Capital Alongside Investors. Simple 60/40 Economics.

The approximately $10.38M common equity requirement is not an outside-investor raise. GP principals and their immediate families are expected to fund at least 10% of total equity — approximately $1.04M or more — leaving no more than approximately $9.34M to be raised from outside LP investors. The sponsor does not charge an asset management fee. After that direct co-investment, the underlying economics remain 60% LP / 40% GP, with operating distributions sequenced so investor cash flow comes first.

~$10.38MTotal Common Equity
≤ $9.34MMaximum Outside LP Raise
10%+Minimum Sponsor / Family Share of Total Equity
$0Sponsor Asset Management Fee
9.8%Avg. Operating Cash-on-Cash
19.4%Projected LP Net IRR
2.21xProjected LP Equity Multiple
$23.0MProjected Total LP Distributions
1

LP Investors Receive Cash First

Available operating distributions are paid to LP investors first toward a 7% annualized return on unreturned invested capital. If that level is not met in a year, the GP’s operating distribution is deferred and can only be recovered later from excess operating cash or the LP residual profit share, to the extent available.

First-dollar operating payment priority to LP investors.
2

LPs Keep the Majority of the Economics

The underlying economics remain a clean 60% LP / 40% GP split. The 7% payment priority affects the timing of operating distributions, not the ultimate economic split. Any deferred GP operating amount is payable only from later excess operating cash or LP residual sale profit, to the extent available.

Simple, transparent and easy to understand.
3

Optional Capital Return at Year 3

If lending conditions are favorable, the portfolio may refinance above the existing loan balances and distribute net proceeds 60% to LPs and 40% to the GP. This could return capital earlier in the hold, but the base-case projections assume no cash-out refinance proceeds and therefore do not rely on them to achieve the stated returns.

Additional refinancing proceeds may be available, but they are not assumed in the return projection.
Sponsor Alignment

Alignment Behind the Structure

This investment is structured as a direct, deal-level partnership rather than an institutional fund arrangement. The Laager Group is responsible for sourcing and negotiating the acquisitions, arranging and managing the assumed financing, overseeing due diligence, coordinating property management and asset execution, managing lender relationships, evaluating refinancing alternatives, and ultimately directing the disposition of the portfolio.

10%+ Sponsor / Family CapitalPrincipals and their immediate families are expected to invest at least 10% of the total equity requirement alongside outside investors.
$0 Ongoing Sponsor Asset-Management FeeThe structure does not include an ongoing sponsor asset-management fee, so sponsor economics are principally tied to investment performance.
LP Operating Payment PriorityOutside investors receive the first 7% annualized distribution priority before the GP receives operating distributions.

At the same time, the principals and their immediate families are expected to invest at least 10% of the total equity requirement alongside outside investors, providing meaningful direct exposure to the same property-level performance. The structure also does not include an ongoing sponsor asset-management fee, so sponsor economics are principally tied to investment performance.

During operations, outside investors receive the first 7% annualized distribution priority before the GP receives operating distributions. Thereafter, the underlying economics are shared 60% to investors and 40% to the GP. We believe this structure aligns sponsor compensation with successful execution of the business plan while preserving meaningful sponsor capital at risk and prioritizing investor cash distributions during the operating period.

Investment at a Glance

The Cincinnati Portfolio in 60 Seconds

Three established suburban multifamily communities acquired at an attractive basis, with in-place agency financing, current cash flow and a defined rent-capture opportunity.

$37.05MPurchase Price
3Properties
234Total Units
~$10.38MEquity
5.16%Blended In-Place Coupon
Why We Like the Portfolio
01 Attractive acquisition basis

Approximately 8.1% weighted-average entry cap, reflecting negotiated pricing from motivated sellers rather than a normalized market cap.

02 Meaningful in-place rent opportunity

Current rents remain below the underwriting target, so a meaningful portion of the business plan comes from closing an existing rent gap rather than relying only on broad market rent growth.

03 Existing agency financing

Approximately 5.16% blended fixed-rate debt through 2029 provides lower-cost leverage than would likely be available on newly originated financing today.

04 Large-format suburban product

The portfolio includes unusually large floorplans, including townhomes and more than 100 den or bonus-room layouts, giving the properties a differentiated position within their submarkets.

05 Three separate assets

The portfolio spans three Cincinnati submarkets and three independently financed properties, providing diversification of operating and asset-level risk.

06 Conservative terminal underwriting

The 8.1% going-in cap reflects transaction-specific, motivated-seller pricing rather than a normalized market cap rate. The base case uses a 7.0% exit cap, and investors can stress that assumption further.

07 A defined plan for the 2029 maturity

The projection assumes refinancing of outstanding debt in 2029 with no cash-out distribution. Refinancing costs are financed into the replacement loans. Additional proceeds may be available but are not assumed; financing remains subject to lender approval.

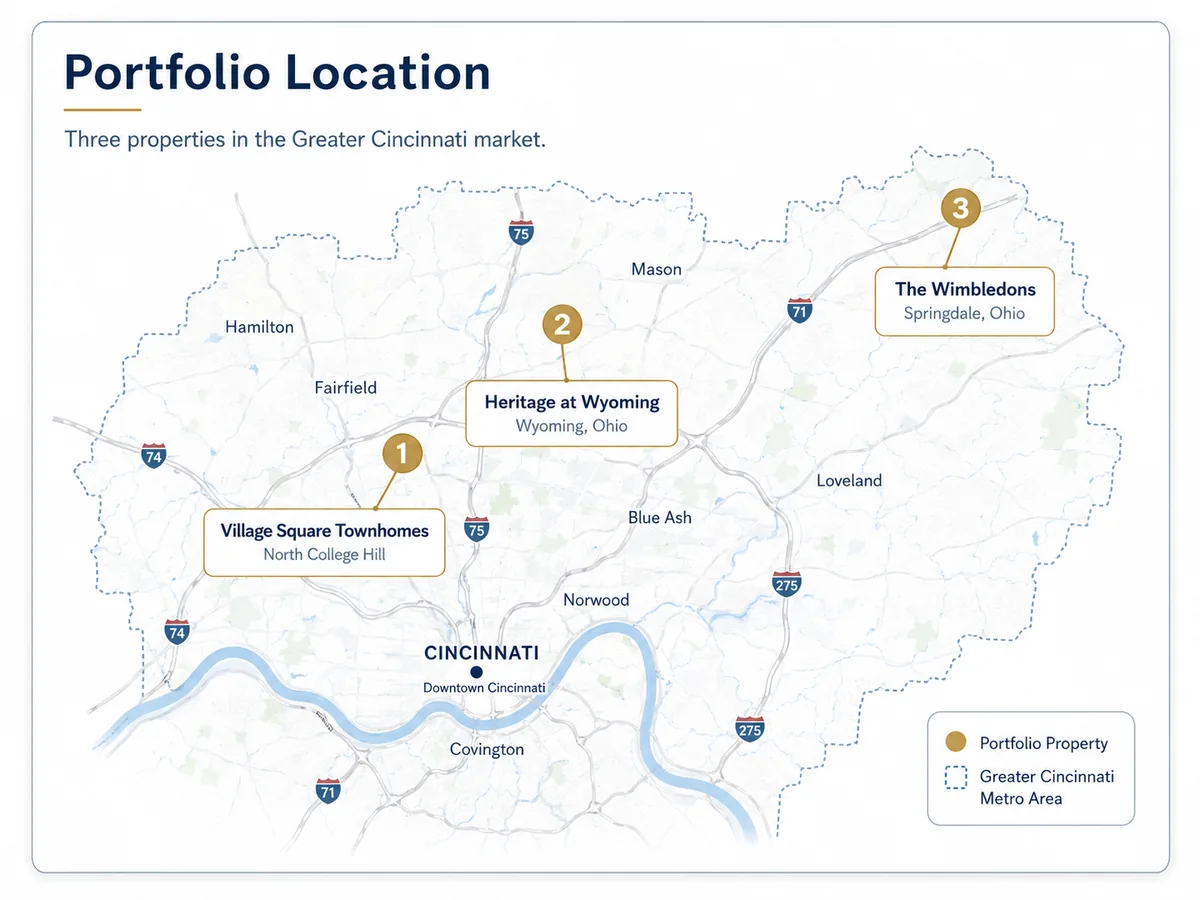
Where the Properties Are
Village Square TownhomesNorth College Hill / Cincinnati
Heritage at WyomingWyoming, Ohio
The WimbledonsSpringdale, Ohio
Map showing Village Square Townhomes, Heritage at Wyoming, and The Wimbledons within the Greater Cincinnati market

All three properties are approximately 10–20 minutes apart.

Portfolio Detail

Three Distinct Property Stories

Three complementary assets, each contributing a distinct role to the portfolio through yield, location quality, or employment access.

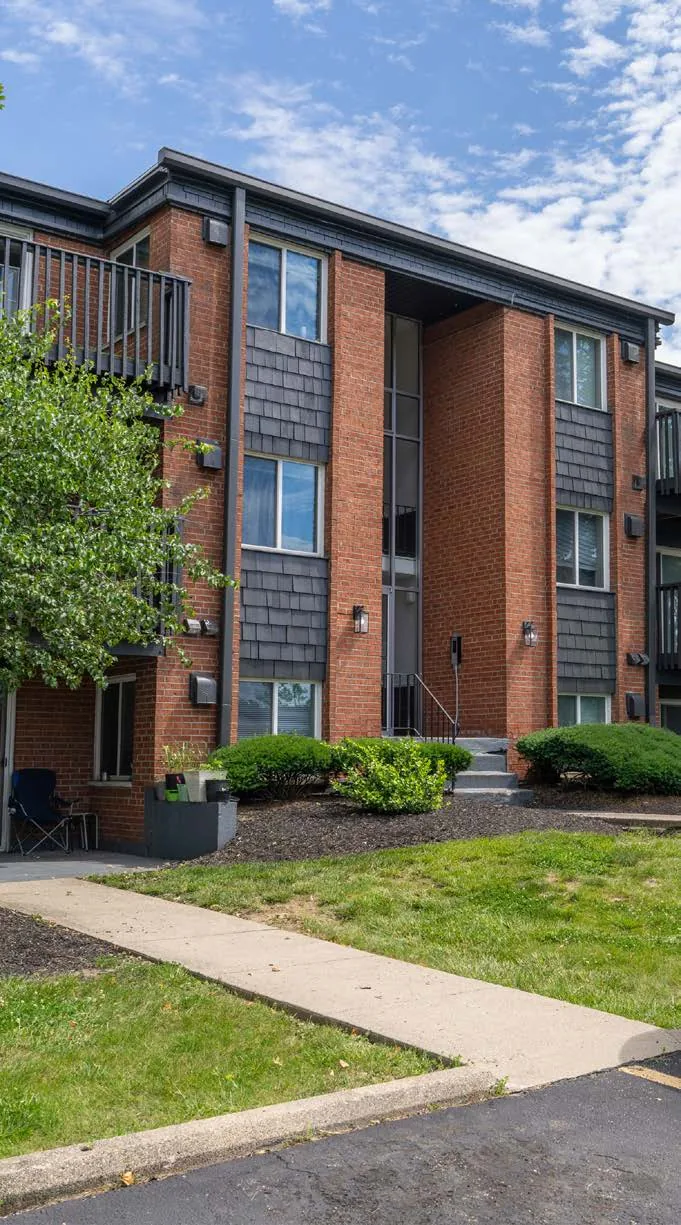
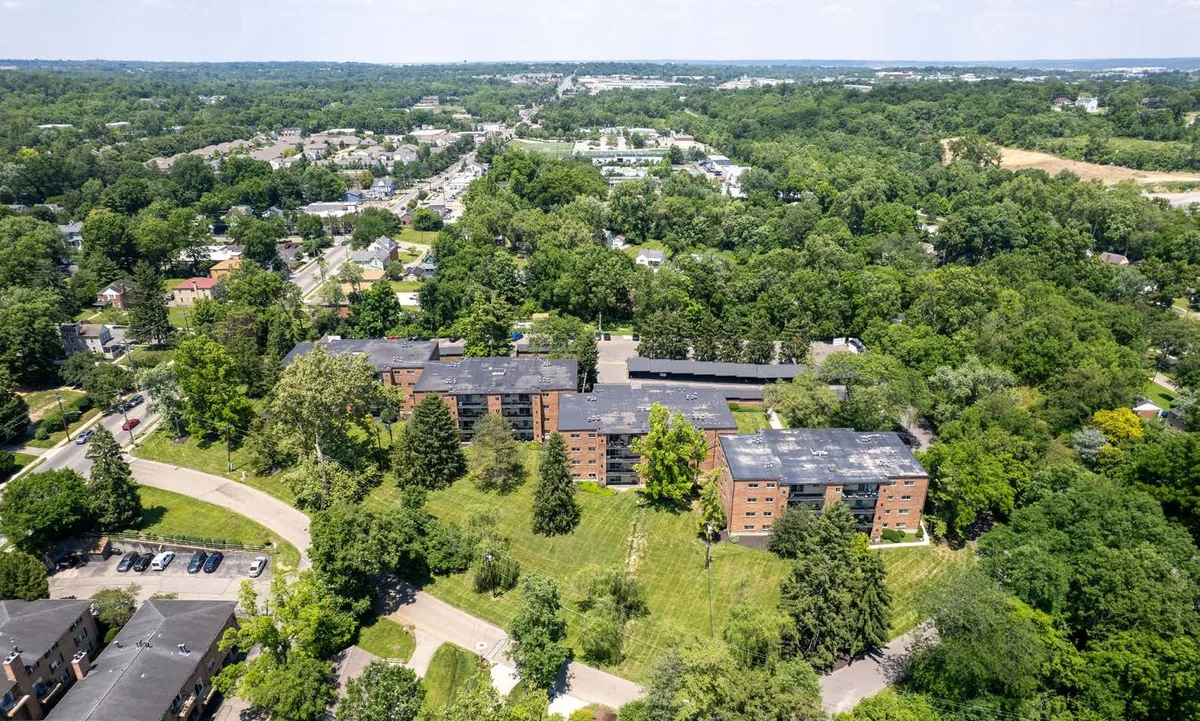
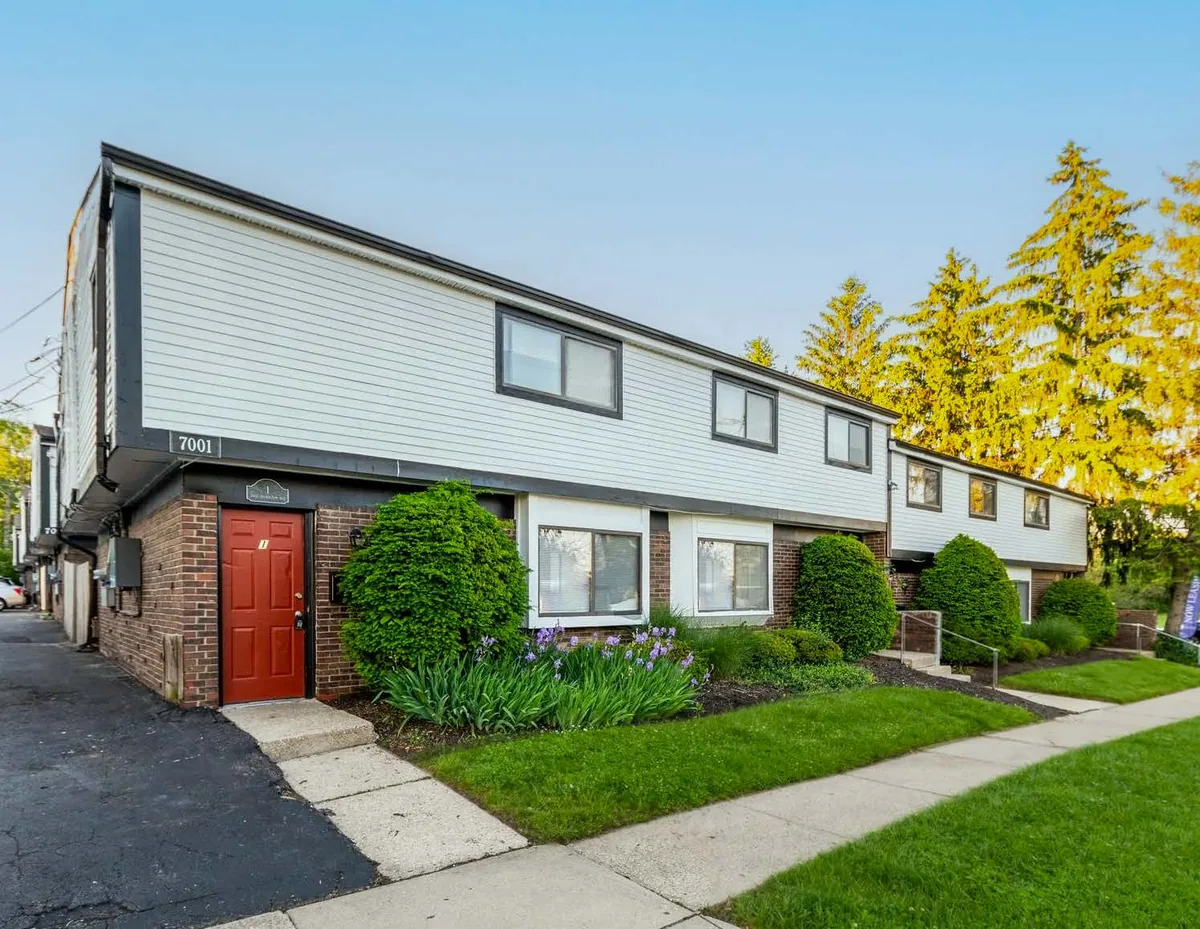
Village Square Townhomes exterior
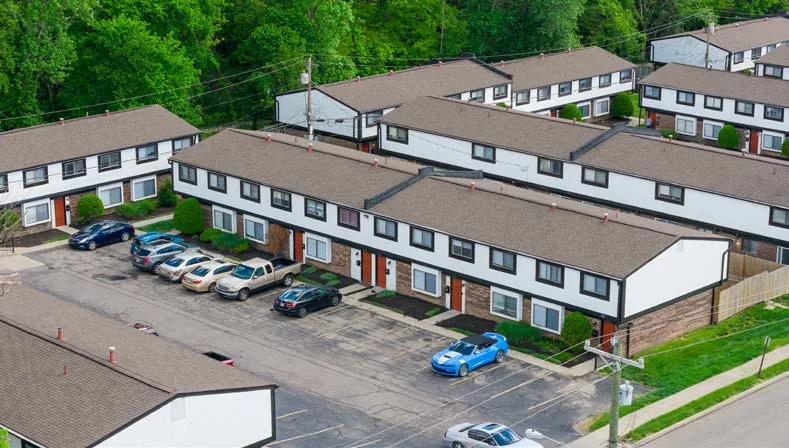
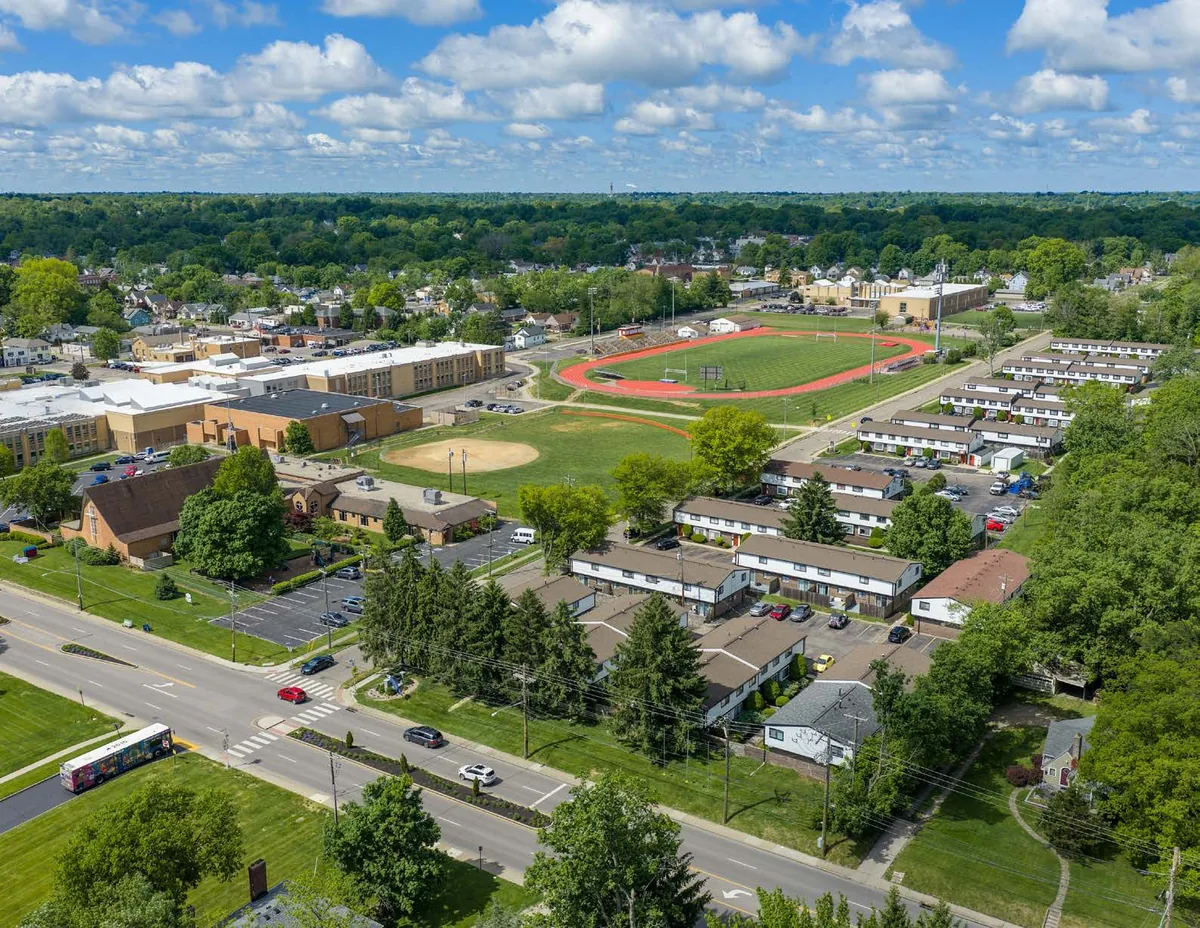
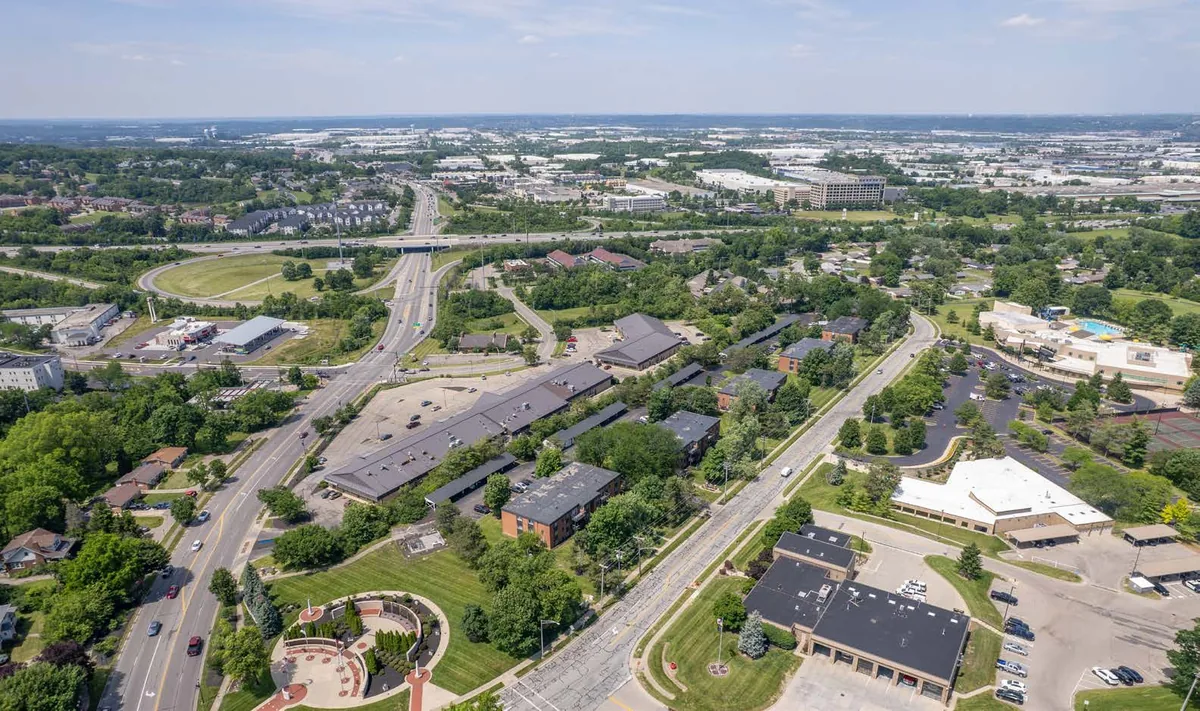
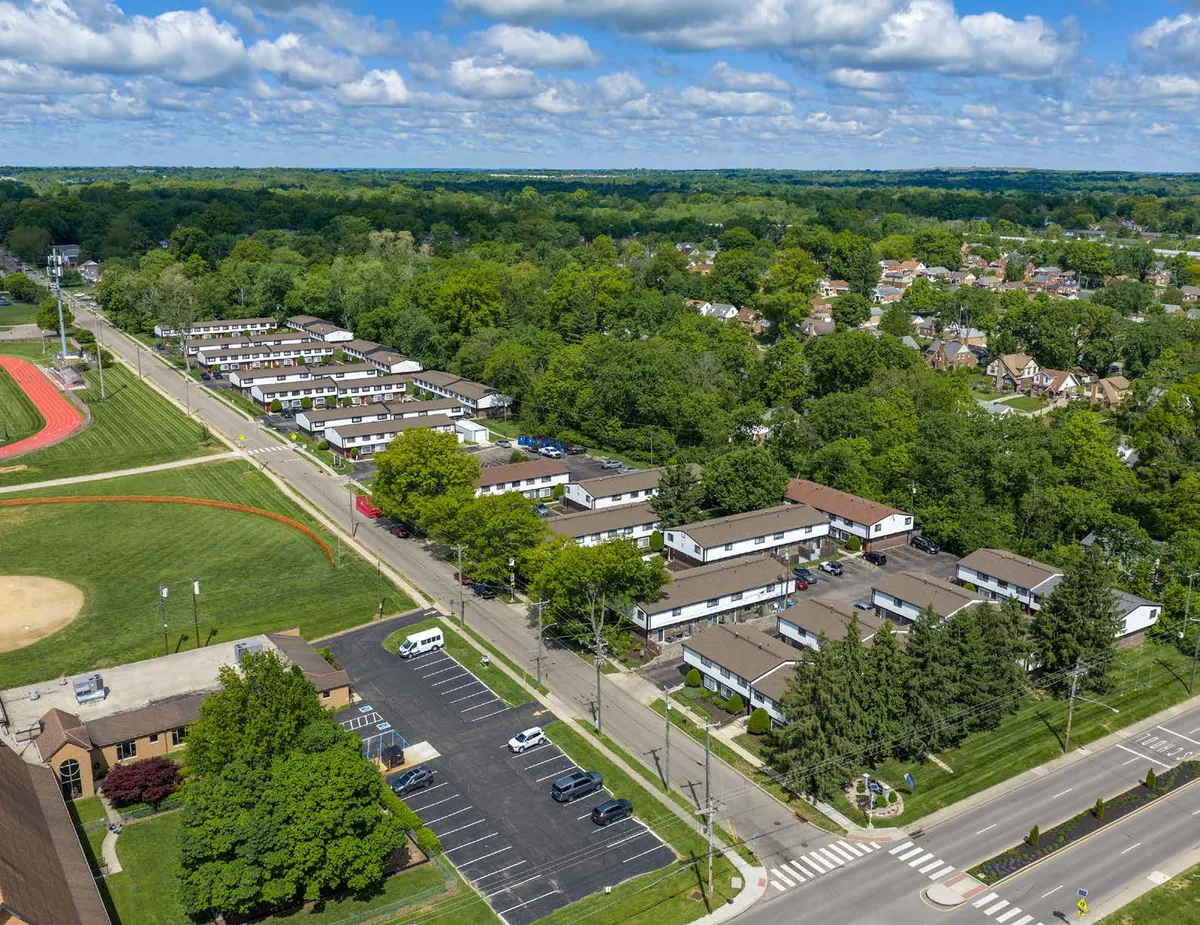
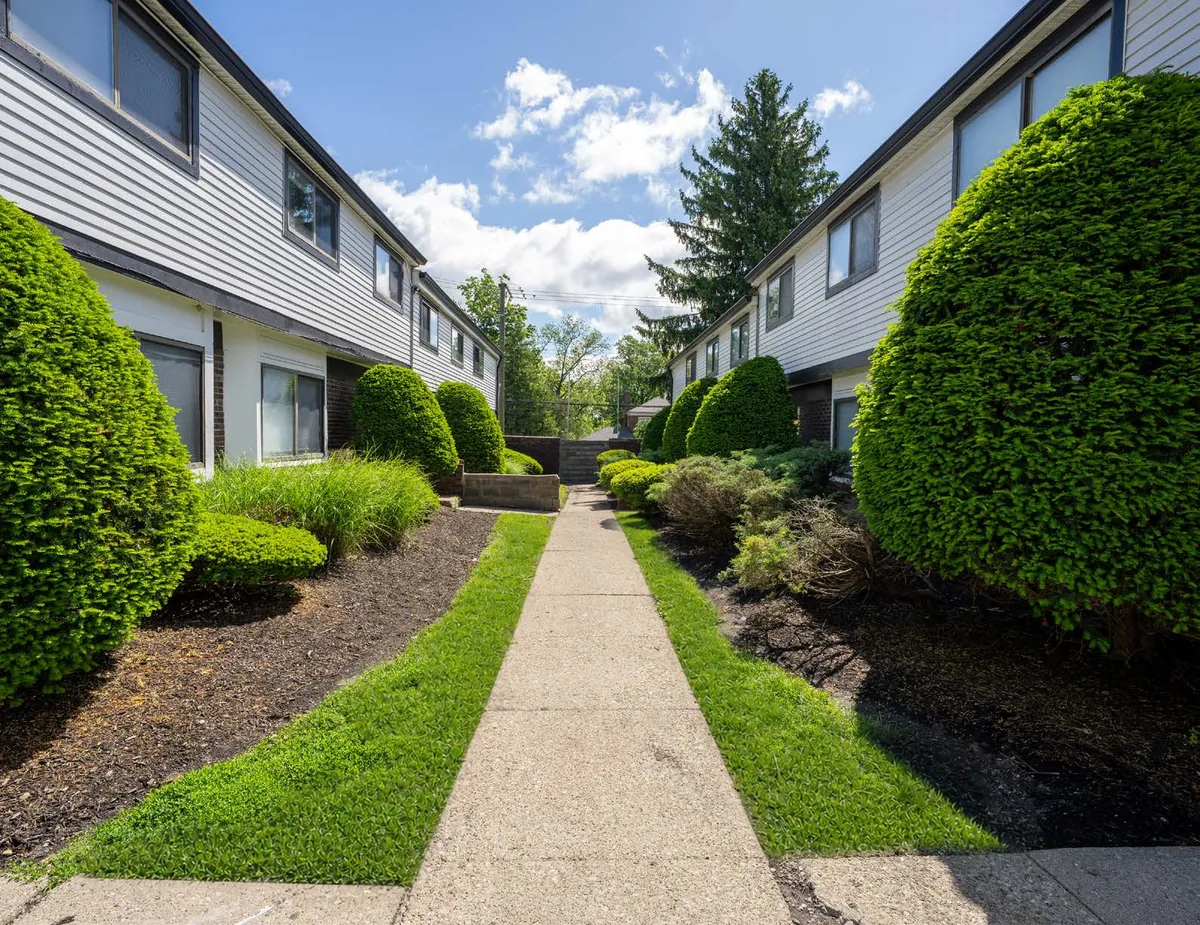
Village Square aerialVillage Square walkway

Village Square Townhomes

North College Hill, Ohio
The portfolio’s highest-yielding asset and clearest mark-to-market story. Village Square brings rare large-format townhome product, strong day-one cash flow, and a straightforward operational playbook.
Purchase Price$14.5M
Revenue Units97
Entry Cap8.95%
Unit Profile3BR / 4BR TH
Why it belongs in the portfolio

Village Square anchors returns with the strongest initial yield and the broadest opportunity to capture rent lift on turnover.

  • Large three- and four-bedroom townhomes with private entries.
  • Significant prior capital investment, including major roof replacements.
  • Operational plan emphasizes turnover rent capture and ancillary-income improvement.
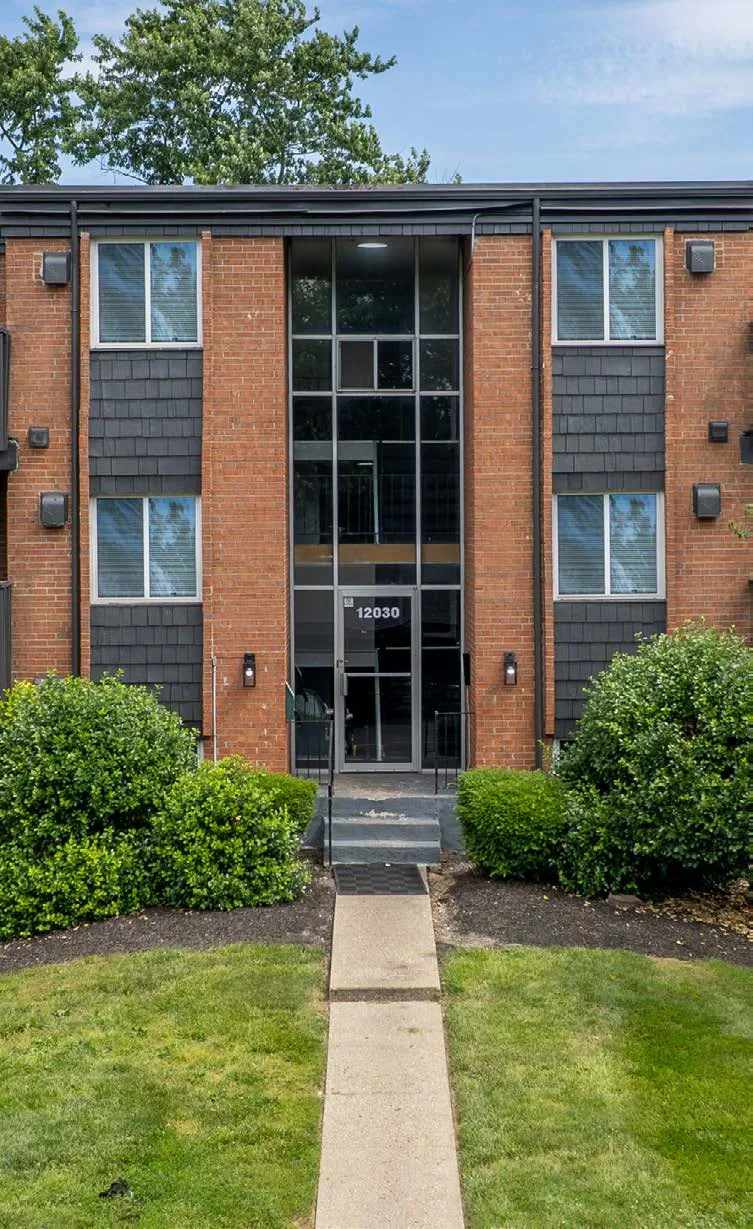
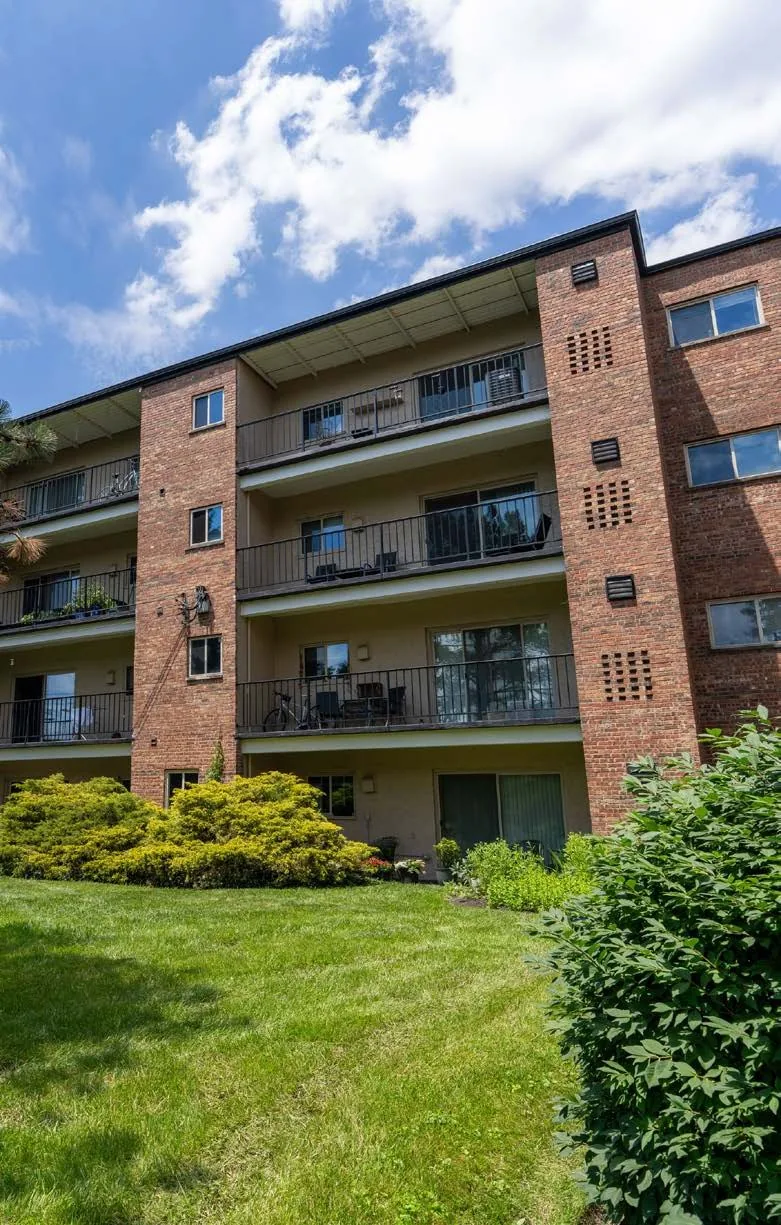
Heritage at Wyoming exterior
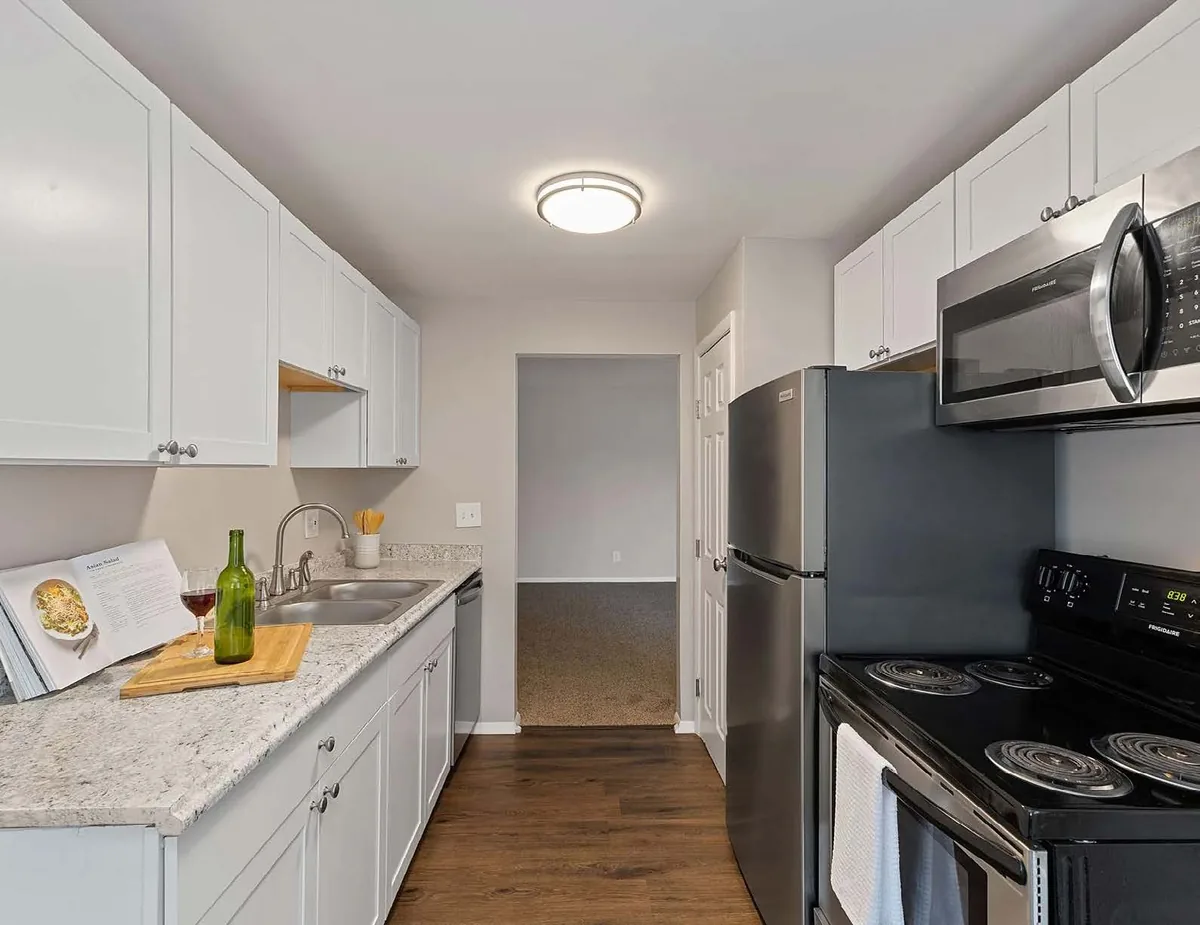
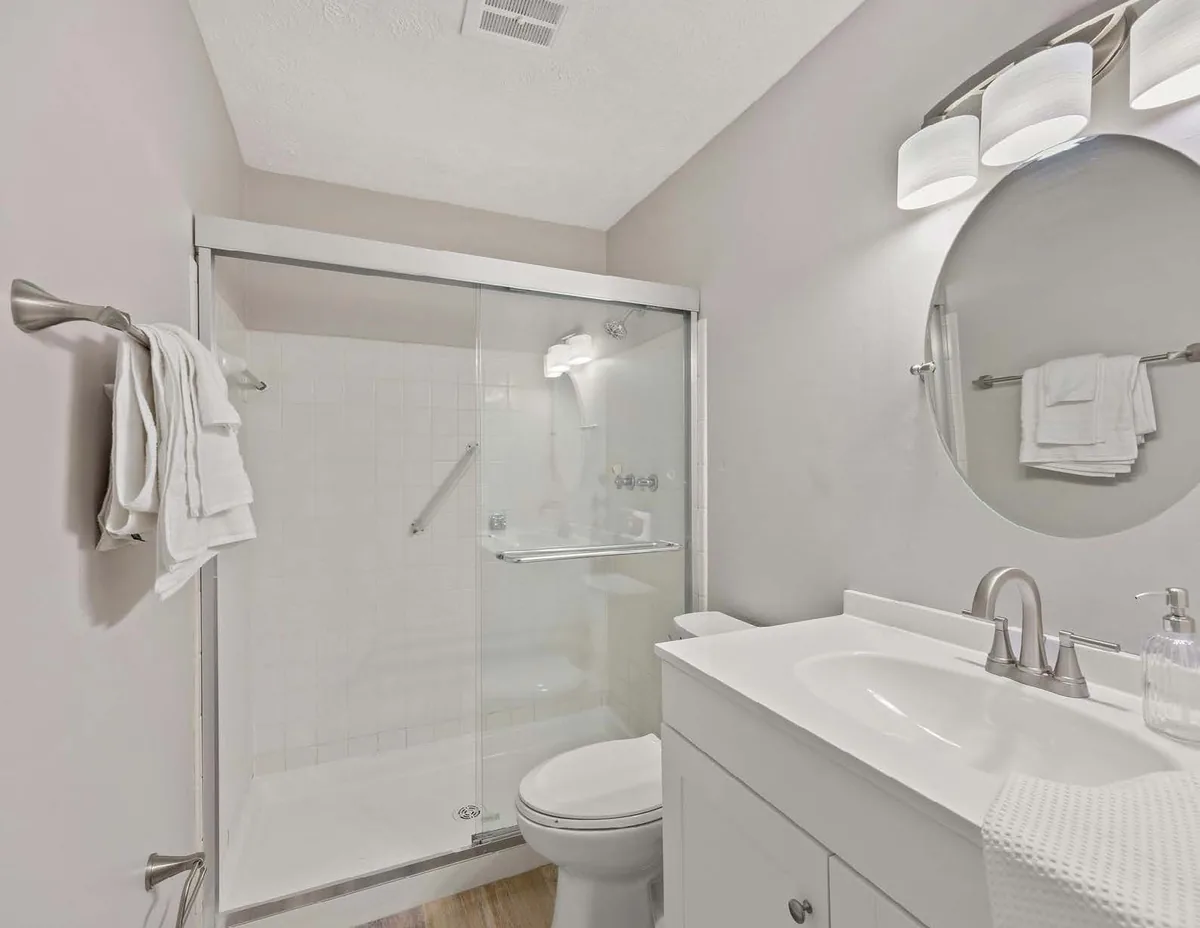
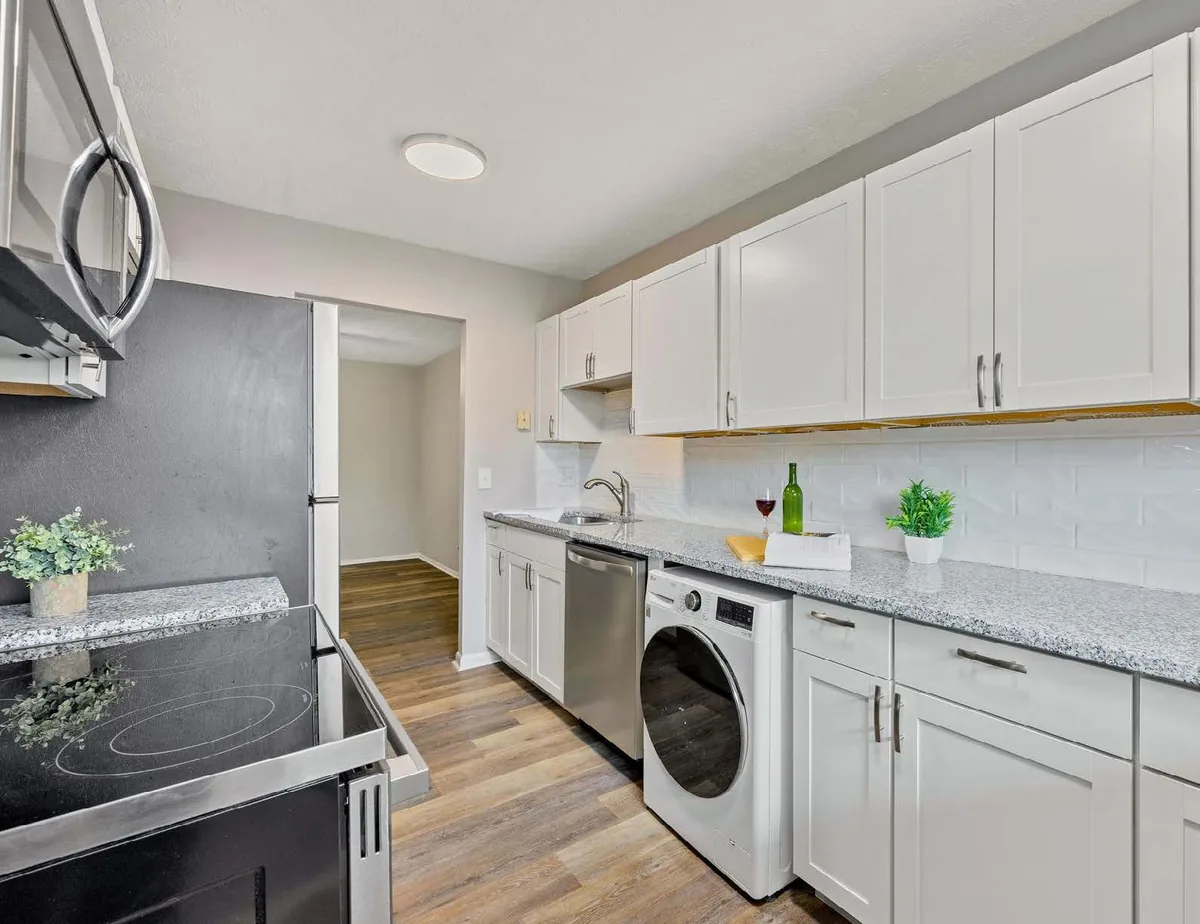
Heritage renovated kitchenHeritage outdoor amenity

Heritage at Wyoming

Wyoming, Ohio
The location asset in the portfolio. Heritage offers the strongest neighborhood and school-district profile, unusually large layouts, and a steadier, lower-risk positioning within the overall three-asset strategy.
Purchase Price$11.65M
Revenue Units63
Entry Cap7.28%
Unit Profile2BR+Den / 3BR
Why it belongs in the portfolio

Heritage lowers portfolio risk by adding the best location profile and supporting the strategy with a more defensive asset.

  • Wyoming location and school-district positioning support resident demand.
  • 52 two-bedroom-plus-den units provide flexible layout appeal.
  • Recent capital investment reduces near-term physical-execution burden.
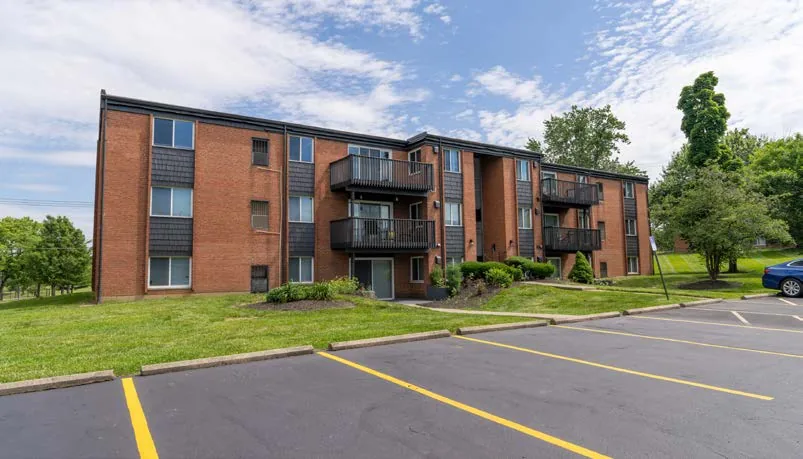
The Wimbledons exterior
The Wimbledons exterior secondary viewThe Wimbledons renovated kitchen

The Wimbledons

Springdale, Ohio
The employment-adjacency asset in the portfolio. The Wimbledons complements Village Square and Heritage with a strong Springdale location, a large den-unit count, and a balanced risk / return profile.
Purchase Price$10.9M
Revenue Units72
Entry Cap7.83%
Unit Profile2BR+Den
Why it belongs in the portfolio

The Wimbledons adds strong commuter and employment access while still preserving meaningful rent-upside potential.

  • 56 two-bedroom-plus-den layouts support flexible leasing and merchandising.
  • Quick access to the I-75 / I-275 employment corridor.
  • Meaningful capital investment since 2019 supports stabilized operations.
Detailed Investment Review

For Investors Who Want to Go Deeper

The sections below provide the full market, capital structure, underwriting, sensitivity analysis, risk discussion and investment diligence detail. Nothing in the detailed analysis is hidden or removed from the presentation.

Offering information. All terms, projections and descriptions on this website are preliminary and are qualified in their entirety by the definitive offering documents. In the event of any inconsistency, the definitive offering documents will control. See Important Disclosures.
Ohio & Greater Cincinnati

A Strong Business Climate. A Diverse Regional Economy.

#1
America’s Top State
for Business · 2026
Ohio Business Climate

Ohio ranks first in CNBC’s 2026 America’s Top States for Business.

CNBC ranked Ohio No. 1 overall after evaluating all 50 states across 138 metrics in 10 categories of competitiveness. Ohio also ranked No. 1 for infrastructure and cost of doing business—strengths that support continued employer investment, market access, and long-term economic activity across the state.

#1 Overall#1 Infrastructure#1 Cost of Doing Business138 Metrics Evaluated
Read the CNBC ranking ↗
Employment Depth & Regional Growth

A broad employment base and continued investment support renter demand across the Greater Cincinnati market.

1.18MCincinnati Metro JobsA broad regional employment base supports renter demand across multiple industries.
97KAdvanced Manufacturing JobsA major regional employment engine spanning aerospace, automotive, chemicals, materials and food production.
211KBusiness & Professional Services JobsA deep white-collar employment base across finance, consumer insights, technology and shared services.
+11.8KProjected Healthcare JobsHealth care and social assistance is projected to lead regional job growth through 2034.
+7.7KProjected Logistics JobsTransportation and warehousing is also projected to remain one of the region’s largest sources of job growth.
$750MResilience / Lilly InvestmentA major life-sciences expansion in the Cincinnati region is expected to add 400 new high-skilled jobs.
Regional Quality of Life

Why the Cincinnati region is easy to live in

Greater Cincinnati riverfront skyline
A thriving regionwith a recognizable urban core
Greater Cincinnati retail and dining
Retail & diningfrom neighborhood centers to downtown
Greater Cincinnati park and greenway
Parks & green spaceincluding the riverfront park system
Wyoming-area residential setting
Strong schoolsparticularly in Wyoming
Established Wyoming residential community
Established communitieswith mature streetscapes and character
Portfolio Submarkets

Three distinct locations, each with its own demand drivers.

North College Hill area aerial
North College Hill

The affordability play: convenient to I-75, shopping, employers, parks, and everyday services, with established housing stock and a practical price point for larger households seeking more space.

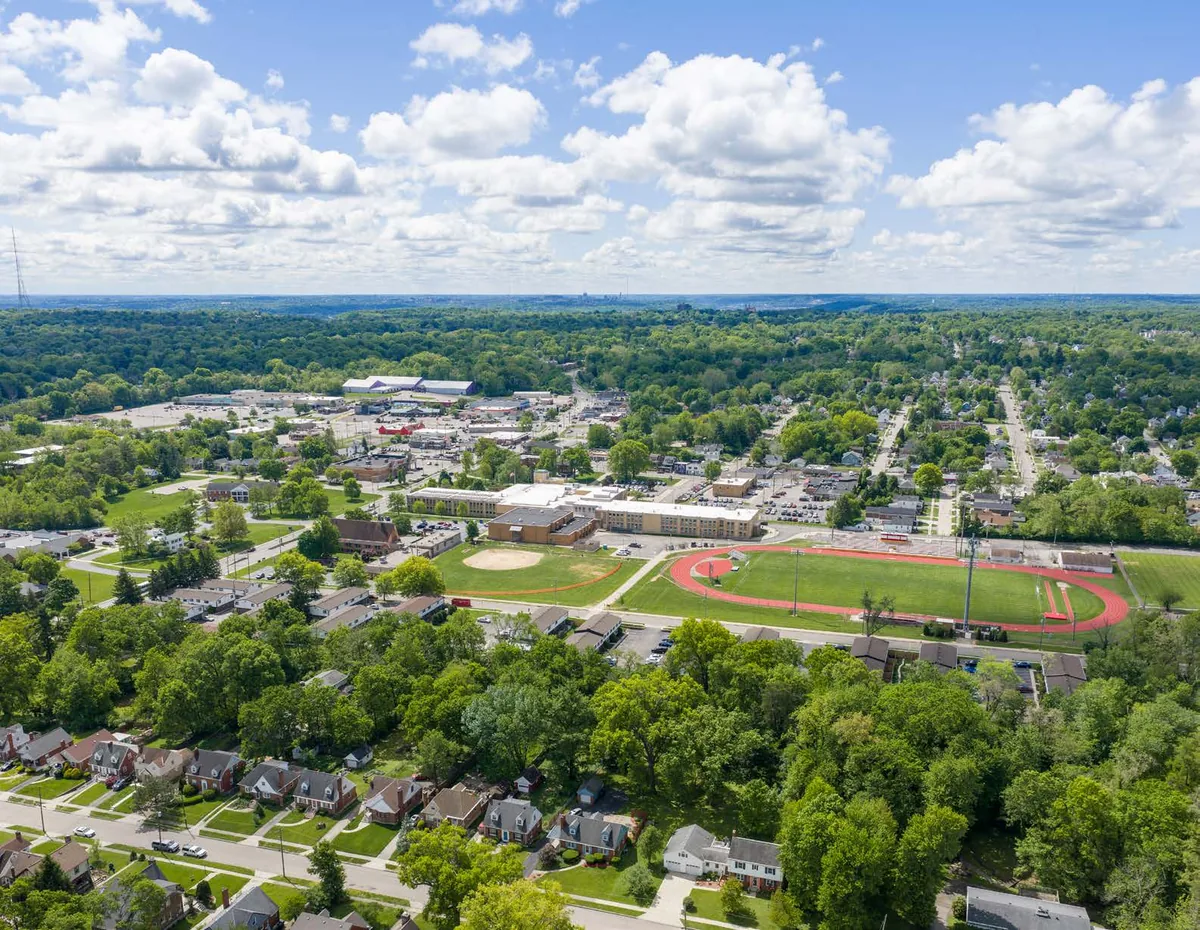
Wyoming area aerial
Wyoming

The location asset: top-ranked schools, mature tree-lined neighborhoods, and a walkable small-town setting, with strong household demographics and limited comparable apartment supply.

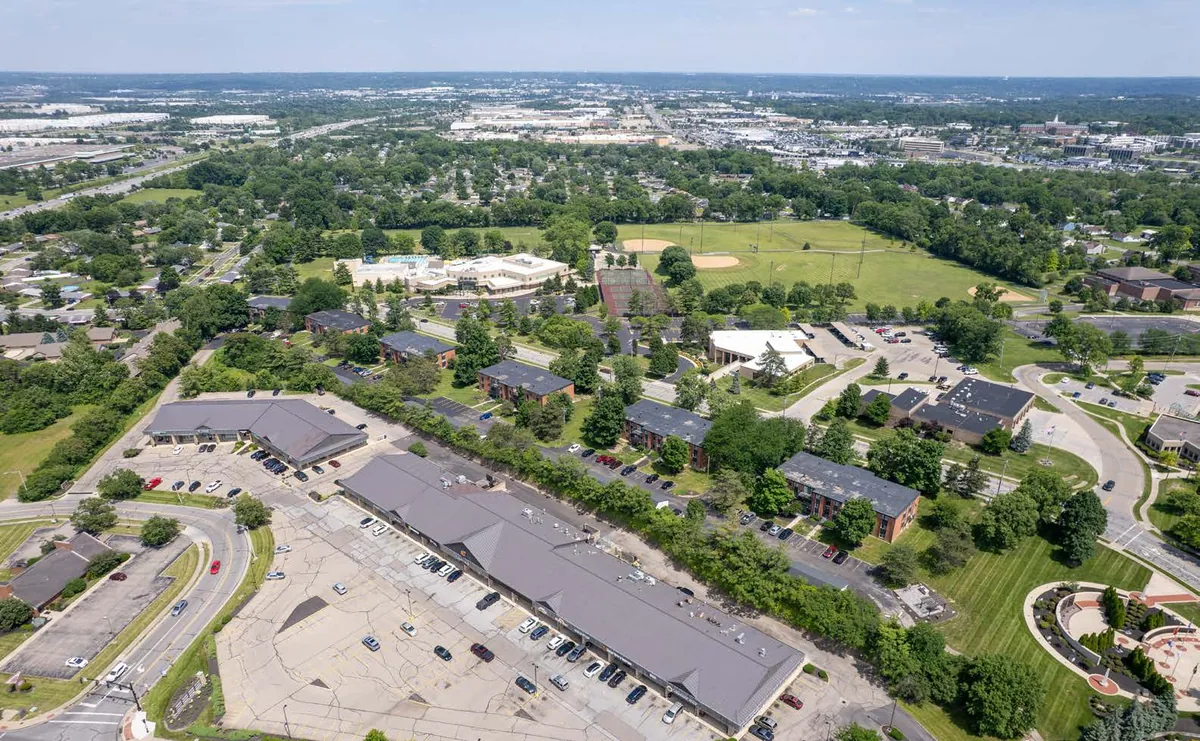
Springdale area aerial
Springdale

The employment-access story: a central position near I-75 and I-275, with major employers, retail, parks, and regional job centers all within convenient reach.

Capital & Debt

In-Place Agency Debt Provides the Capital Structure Backbone

The portfolio combines a $37.05M acquisition basis with approximately $29.8M of assumed debt and a defined capital plan. The debt is primarily fixed-rate, interest-only agency financing with maturity in 2029.

Assumed Debt$29.81M
Blended Coupon5.16%
Purchase LTV80.5%
Total Common Equity~$10.38M
Max Outside LP Raise~$9.34M
Sponsor / Family Co-Invest≥ $1.04M

Sources & Uses

Purchase price$37,050,000
Capital plan$1,532,300
Closing costs, fees & reserves$1,608,075
Total capitalization$40,190,375
Assumed senior debt$29,814,035
Total common equity$10,376,340
Minimum sponsor / principal / family co-investment (10%)≥ $1,037,634
Maximum outside LP capital to be raised≤ $9,338,706

Debt by Asset

AssetDebtCouponPurchase LTVMaturity
Village Square$11.79M5.24%81.3%2029
Heritage$9.52M4.985%81.7%2029
The Wimbledons$8.51M5.24%78.0%2029
Portfolio$29.81M5.16%80.5%2029

Refinance / Exit Discipline

Base Refi Rate6.25%
Base Refi StructureNo cash-out
Exit Cap7.00%
Target Hold5 Years
Underwriting Framework

Operating Performance and Financing, Clearly Separated

The investment case starts with existing cash flow, a defined rent-capture schedule and a five-year hold. The sensitivity analysis changes three assumptions while keeping the financing structure fixed.

The projection depends on

  • Capturing the underwritten rent gap as leases turn.
  • Maintaining underwritten occupancy and executing the capital plan.
  • Replacing outstanding loans in 2029 at the assumed 6.25% rate.
  • Replacement loans covering outstanding balances plus 1% refinancing costs.
  • A sale at the selected capitalization rate in Year 5.

What investors can explore

  • Annual market rent growth from 1.0% to 4.0%.
  • Annual expense-growth settings from 2.5% to 4.5%.
  • Exit capitalization rates from 6.5% to 8.0%.
  • Annual LP distributions and five-year return measures.
  • Changes in projected returns compared with the base case.

The 2029 Refinancing Plan

The projection assumes no additional investor contribution at refinancing and no cash-out distribution. The sensitivity controls change operations and sale value while this financing assumption remains fixed.

Today5.16% blended coupon

Existing loan schedules are carried through Year 3, including the scheduled amortization at The Wimbledons.

Main ProjectionFinance balances and costs

Outstanding debt plus refinancing costs is replaced at 6.25%, interest-only. No cash-out is assumed. Approximately $301,000 in refinancing costs is financed into the replacement loans.

Distribution AssumptionNo cash-out assumed

Additional proceeds may be available at refinancing, but the return projection includes only operating cash and the Year 5 sale.

Financing AssumptionSubject to approval

The return projection does not establish financing availability. Actual refinancing remains subject to lender terms, appraisals and approval.

Investment sensitivity

Check the assumptions. See the effect.

Adjust three assumptions to see how projected LP returns change.

Base case 5-year hold · 3% rent growth · 3% expense growth · 7% exit cap · 6.25% refinance rate

Your assumptions

3.00%
1.0%Base: 3.0%4.0%

Market growth from Year 2 onward. The underwritten rent-capture schedule stays fixed.

3.00%
2.5%Base: 3.0%4.5%

Adjusts each property's expense path from Year 2. Year 1 costs stay fixed.

7.00%
6.5%Base: 7.0%8.0%

A higher cap rate means a lower sale value for the same property income.

Base

Five-year projection · no cash-out
Avg. annual cash-on-cash—On original equity
LP net IRR—Compared with base
LP equity multiple—Compared with base

Cash distributions on $100,000 invested

Illustrative LP allocation
YearOperating cashSale proceedsTotal

Refinancing costs are financed. Year 5 sale proceeds are after repayment of the larger loans and include returned capital. Figures are rounded independently.

Vacancy, rent capture and financing terms stay fixed. The projection assumes refinancing of outstanding debt in 2029 with no cash-out; additional proceeds may be available but are not assumed.

Assumptions & methodology

Operations & financing

  • Five-year hold; property-specific vacancy and rent-capture schedules remain fixed.
  • Existing loan schedules run through Year 3. Replacement loans cover the outstanding balances plus refinancing costs, at 6.25% interest-only, subject to lender approval.
  • Replacement loans total approximately $30.08 million, including $301,000 in financed refinancing costs; no additional investor contribution is assumed.
  • The selected exit cap is applied to Year 5 NOI; sale costs are 1%.

Investor returns

  • 60% LP / 40% GP economics, with LP operating payment priority toward 7%; this is not a guaranteed return. Deferred GP distributions may be repaid from later cash flow or sale profit.
  • IRR uses annual cash flows. Equity multiple includes returned capital. Average cash yield excludes sale proceeds.
  • The $100,000 example scales the portfolio LP cash flows proportionally.

These selected sensitivities do not test every risk or establish a limit on possible losses. Full calculation methodology

Next Step

Interested in the Cincinnati Portfolio?

Offering documents and subscription materials are currently being prepared. If you would like to discuss the opportunity with us or be notified when the offering documents become available, please contact The Laager Group and indicate your interest.

Any indication of interest is non-binding and does not constitute a subscription, commitment to invest, or reservation of an allocation.

Indicate Interest
Key Underwriting Considerations

Investment Diligence Summary

The portfolio combines strong in-place cash flow with assumable agency financing and a business plan centered on measurable operating execution rather than development or unusually aggressive market growth. The points below summarize the principal underwriting considerations investors may wish to evaluate alongside the interactive sensitivity analysis.

Existing financingApproximately 5.16% blended fixed-rate agency debt through 2029.
Entry basis vs. exit assumptionApproximately 8.1% weighted-average entry cap reflects negotiated, motivated-seller pricing and is not intended as a proxy for normalized market valuation; base underwriting uses a 7.0% exit cap.
Rent assumptionsBase market rent growth of 3%, with 1%–4% available in the sensitivity analysis. Rent capture remains fixed.
Existing rent opportunityA meaningful portion of projected revenue growth comes from closing the current rent gap, separate from future market rent growth.
Refinance underwritingThe main projection assumes replacement of outstanding balances at 6.25%, with no cash-out. Refinancing costs are financed into the replacement loans, with the additional interest and repayment included in returns.
Property-level credit testProperty-level debt-service coverage forms part of the underwriting. The simplified controls do not establish refinancing availability.
Loan isolationThe three agency loans are separate, non-recourse and non-cross-collateralized. The projection assumes replacement of each outstanding loan balance plus financed refinancing costs. Sale equity is floored at zero property by property, subject to the loan documents.
Unit convention234 physical units; 232 revenue units are used in underwriting because one unit at Village Square and one unit at Heritage are currently designated as non-revenue office units.
Key Investor Questions

Six Questions That Matter Most

These questions highlight the principal factors we believe investors should understand when evaluating the portfolio — including the strengths of the opportunity, the assumptions behind the underwriting, and the areas that deserve the most attention.

Where actual results may differ most

The largest differences between actual results and underwriting are most likely to arise from a relatively small number of variables:

  • Pace of rent mark-to-market
  • Stabilized vacancy
  • Refinance terms in 2029
  • Terminal capitalization rate
  • Operating expense inflation

The portfolio is being acquired with assumable agency debt at an approximately 5.16% blended coupon. That financing was originated in a more favorable lending environment than exists today and allows the portfolio to benefit from both lower borrowing costs and higher leverage than would generally be available on newly originated debt. The higher leverage does increase sensitivity to operating performance, which is why we focus closely on property-level DSCR and cash flow. In our view, however, the combination of attractive fixed-rate debt and strong in-place income is one of the portfolio’s most important advantages.

The portfolio is being acquired at an approximately 8.1% weighted-average entry cap, but that unusually high going-in yield is transaction-specific and is not intended to represent a normalized market cap rate. The acquisition reflects negotiated pricing from motivated sellers and creates an attractive basis at entry. The base underwriting uses a 7.0% exit cap. In other words, the model does not assume that 8.1% is the prevailing market rate today and then require the market to compress from that level; it assumes the acquisition basis is unusually favorable relative to normalized valuation. Investors can vary the exit assumption from 6.5% to 8.0% in the sensitivity analysis.

Base underwriting assumes approximately 3% annual market rent growth from Year 2, in addition to the existing rent-capture schedule. The simplified sensitivity analysis varies market growth from 1% to 4%. Rent capture and vacancy remain fixed at their property-level underwriting schedules, so these controls do not represent a comprehensive downside model.

The projection assumes replacement of the outstanding debt in 2029, at 6.25% interest-only, with no cash-out distribution. Refinancing costs are financed into the replacement loans; no additional investor contribution is assumed. Additional proceeds may be available but are not included in projected returns. Actual financing remains subject to underwriting and lender approval.

The portfolio does not require a major redevelopment or highly speculative renovation program. Much of the opportunity comes from relatively straightforward operating execution: narrowing the current rent gap, maintaining occupancy, managing expenses, and selectively improving units where the economics justify it. That creates a business plan that is operational rather than development-driven and allows investors to see clearly which assumptions are producing the projected returns.

The portfolio has in-place income, existing fixed-rate financing and three separate assets. Investors can explore changes in rent growth, expenses and exit value. Vacancy, rent capture and financing terms remain fixed in this simplified analysis; results are conditional on those assumptions and do not establish a floor on potential losses. More severe or different assumptions require separate underwriting.

Risk & Mitigation

Key Risks and How They Are Reflected in the Underwriting

Each risk below can affect investment performance. The underwriting and sensitivity analysis are designed to show how these variables are addressed and how outcomes change when assumptions are made less favorable.

RiskWhy It MattersUnderwriting / Mitigation Response
Exit cap expansionA higher terminal cap rate reduces the sale value even if NOI performs.Base exit cap is 7.0%; investors can stress the terminal cap materially higher in the interactive sensitivity.
Refinance rates / availabilityHigher rates or tighter lending standards may reduce proceeds or make refinancing unattractive.The return projection assumes replacement of outstanding debt at 6.25%, with no cash-out. Refinancing costs are included. Financing availability and different lending terms require separate underwriting; this projection is not a financing commitment.
Rent growth / mark-to-marketRent increases may take longer or prove smaller than underwriting assumes.The sensitivity analysis varies market rent growth while retaining the underwritten rent-capture schedule. Slower rent capture is a separate risk that is not varied by these controls.
VacancyHigher vacancy directly reduces effective revenue and NOI.Property-specific vacancy remains fixed at the underwritten schedule. Additional vacancy is not tested by the three controls and requires separate analysis.
Expense inflationTaxes, insurance, payroll, utilities and maintenance can outpace revenue growth.The expense-growth setting ranges from 2.5% to 4.5% and adjusts each property’s expense path from Year 2. Year 1 expenses remain fixed.
Older vintage / physical systems1960s–1970s assets can require unexpected capital investment.Each asset has received substantial recent capital investment, and the acquisition underwriting includes a defined capital plan and reserves.
Execution across three assetsThree simultaneous business plans create management complexity.The assets are geographically concentrated, have similar suburban multifamily operating profiles, and are underwritten with defined property-level scopes.
Property-level loan isolationIn a severe downside, one property's value may fall below its outstanding debt.The three loans are separate, non-recourse and non-cross-collateralized. At refinancing, ownership may use surplus proceeds from one property to cure a shortfall at another. At sale, an underwater asset does not reduce positive equity in the other properties, subject to customary non-recourse carve-outs and definitive loan terms.
Next Step

Interested in the Cincinnati Portfolio?

Offering documents and subscription materials are currently being prepared. If you would like to discuss the opportunity with us or be notified when the offering documents become available, please contact The Laager Group and indicate your interest.

Any indication of interest is non-binding and does not constitute a subscription, commitment to invest, or reservation of an allocation.

Indicate Interest
Legal

Important Disclosures

Informational purposes; definitive documents control. This website is for informational and discussion purposes only and does not constitute an offer to sell or a solicitation of an offer to purchase any security. Any offering of securities will be made only pursuant to definitive offering documents, including the applicable private placement memorandum, subscription agreement, limited liability company or partnership agreement, and related investor documents, each as amended or supplemented from time to time. In the event of any inconsistency between information presented on this website and the definitive offering documents, the definitive offering documents will control.

Preliminary information and forward-looking statements. Information presented herein is preliminary, is subject to change without notice, and should not be relied upon as a representation or guarantee of future performance. Certain information includes projections, estimates, targets, forward-looking statements and assumptions regarding future operating results, financing, rents, expenses, capitalization rates, property values and investment returns. Actual results may differ materially, and no assurance can be given that any projected or targeted results will be achieved.

Investment risk. Investments in real estate and private securities involve substantial risk, including the possible loss of all or a substantial portion of invested capital, lack of liquidity, leverage risk, operating risk, refinancing risk and changes in economic, interest-rate and real-estate market conditions. Past performance, if referenced, is not indicative of future results.

No professional advice; third-party information. Nothing on this website constitutes legal, tax, accounting or investment advice. Prospective investors should conduct their own independent investigation and consult their own legal, tax, financial and other advisers before making an investment decision. Photographs, market data, demographic information and other third-party information are believed to be reliable but have not necessarily been independently verified and are subject to change.

Rule 506(c) offering. The securities described on this website are expected to be offered pursuant to Rule 506(c) of Regulation D under the Securities Act of 1933. This website is for informational and general solicitation purposes only and does not constitute the definitive offering documents. Any investment will be made solely pursuant to the applicable subscription agreement, private placement memorandum and other definitive offering documents. Investors must qualify as accredited investors, and accredited investor status will be subject to verification as required by Rule 506(c). The securities have not been registered under the Securities Act of 1933 or applicable state securities laws and are subject to restrictions on transfer and resale.